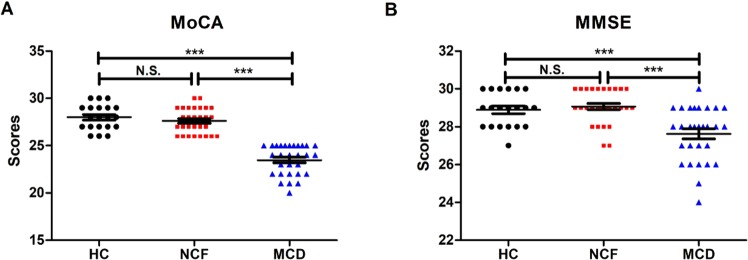
Figure 1.
Assessment of cognitive function by MoCA and MMSE. (A) MoCA scores among the three study groups (F2,75 = 83.21, p < 0.0001). (B) MMSE scores among the groups (F2,75 = 13.89, p < 0.0001). Data are shown as means ± standard error of means (n = 20–29); ***p < 0.001. HC: healthy control; MCD: mild cognitive decline; MMSE: Mini-Mental State Examination; MoCA: Montreal Cognitive Assessment; NCF: normal cognitive function; N.S.: not significant.

