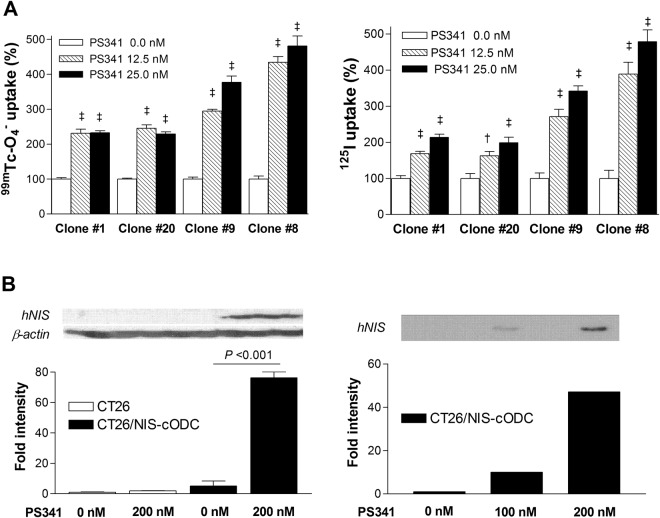
Figure 3.
CT26 cells stably expressing NIS-cODC. (A) Effects of 48 h exposure to 12.5 or 25 nM bortezomib on uptake of 99mTc-04− (left) and 125I (right) on four different stable expressing CT26/NIS-cODC clones. Bars are mean ± SD of % uptake of quadruplicate samples. ‡P < 0.001, †P < 0.005, compared to controls. (B) Western blots for NIS and β-actin in CT26 and CT26/NIS-cODC cells using whole cell lysates (left). Cropped blot parts are separated by space. For full length blot pictures, see Supplement Fig. 2. NIS in CT26/NIS-cODC cells using membrane protein (right). Blots were cropped to show representative blots. For full length blot pictures, see Supplement Fig. 3. Bortezomib treatment was for 36 h. Bars on the left side are mean ± SD of duplicate band intensities normalized to β-actin bands expressed as fold of controls.

