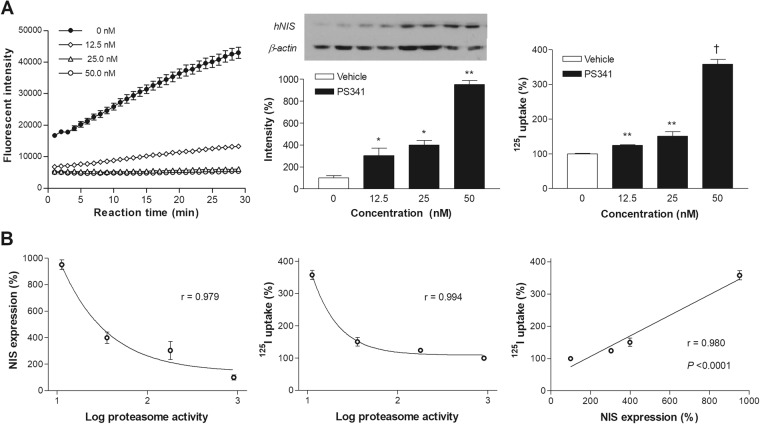
Figure 4.
Relation of NIS expression and radioiodine uptake to proteasome activity. (A) Proteasome activity (left), NIS expression (middle) and 125I uptake (right) in CT26/NIS-cODC cells exposed for 16 h to graded doses of bortezomib. Blots are cropped for representative blots and quantified as mean ± SD in fold of controls of duplicate band intensities normalized to β-actin bands. For full length blot pictures, see Supplement Fig. 4. Bars on the right are mean ± SD of % uptake of triplicate samples. ‡P < 0.001, **P < 0.01, **P < 0.05, compared to controls. (B) Correlations between NIS expression (left) or 125I uptake (middle) and log proteasome activity, and between NIS expression and 125I uptake (right). Proteasome activity is measured as rate of increase in fluorescent intensity (arbitrary units). Correlation coefficients (r) and P values are from regression analysis.

