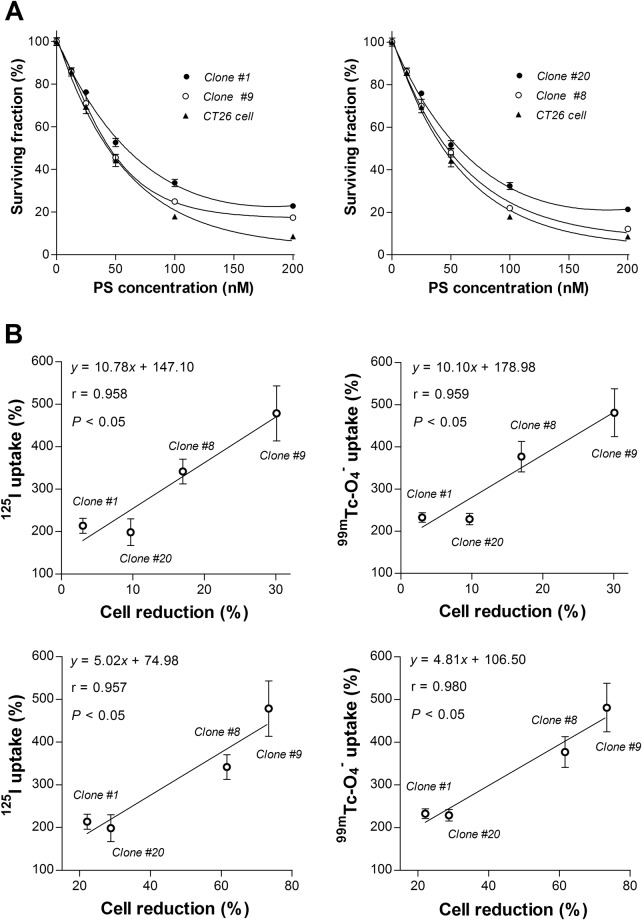
Figure 5.
Treatment response of CT26/NIS-cODC clones and relation to NIS transport. (A) Surviving fraction of clone #1 and #9 (left) or clone #8 and #20 (right) in comparison to CT26 cells after 72 h treatment with graded doses of bortezomib. Bars are mean ± SD of % survival of quadruplicate samples. (B) Linear correlation between 125I (left) or 99mTc-04− uptake (right) at 48 h of exposure to 25 nM bortezomib and cytotoxic effects of 72 h treatment with 25 nM (top) or 50 nM bortezomib (bottom) in four different stable CT26/NIS-cODC clones. Bars are mean ± SD of % uptake of quadruplicate samples. Correlation coefficients (r) and P values are from linear regression analysis of quadruplicate samples for each stable clone.

