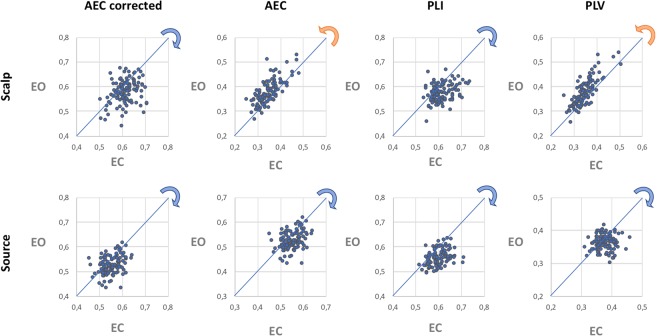
Figure 3.
Scatterplot of leaf fraction for eyes-closed and eyes-open resting-state, based on scalp (top row) and source analysis (bottom row) and for each connectivity measure (different columns). The blue and orange arrows indicate the direction of the shift in network topology when comparing the eye-closed and eyes-open condition. Note that for the AEC and PLV the leaf fraction is higher in the eyes-open condition than in the eyes-closed condition for the scalp-level MSTs, whereas the opposite condition effect is found for the source-level MSTs.

