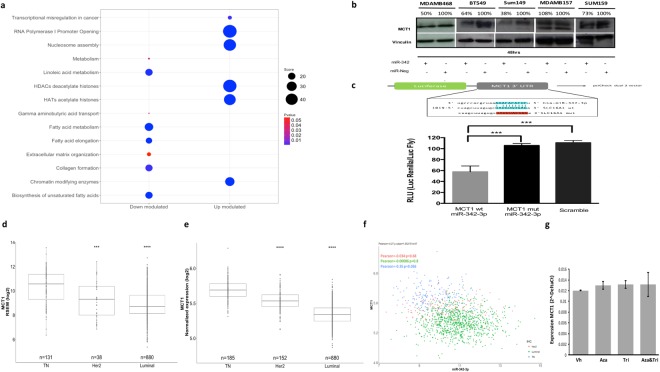
Figure 3.
MiR-342-3p regulates the expression of its putative target MCT1. (a) Pathway enrichment analysis of the differentially expressed genes after miR-342-3p transfection (48 hr) in MDAMB468 cells, performed with Enrichr database using KEGG, Reactome and Gen Ontologies functional annotations. (b) MCT1 protein expression at 48 hr post-transfection of miR-342-3p in TN cell lines by an immunoblotting analysis. Densitometric analysis is indicated as percentage above the blot (the blot is representative of 3 independent experiments). Plot figure is a group of blots cropped from different gels, complete and original blots are shown in Sup Fig. 4 (c) MDAMB468 cells were co-transfected with: miR-342-3p, psi-Check dual-luciferase system containing the miRNA predicted binding site of the MCT1 3′UTR and one mutated form (Mut1). Renilla luciferase activity was measured 24 hr after transfection and normalized on Firefly luciferase activity. Expression level of MCT1 in TCGA (d) and Metabric (e) database subgrouped by IHC subtypes, TN tumors: ER−, PR− Her2−, Her2 tumors: ER−, PR+ and Her2+ and luminal tumors: RE+, RP+/− and HER2 −/+. (f) Correlation of MCT1 and miR-342-3p expression levels in breast cancer (Metabric data). (g) qRT-PCR evaluation of miR-342-3p expression level after 5-azacytidine and/or trichostatin treatment on MDADB468 cells. Results of three independent experiments with three technical replicates are represented as the geometric mean +/− standard deviation error.

