Figure 7.
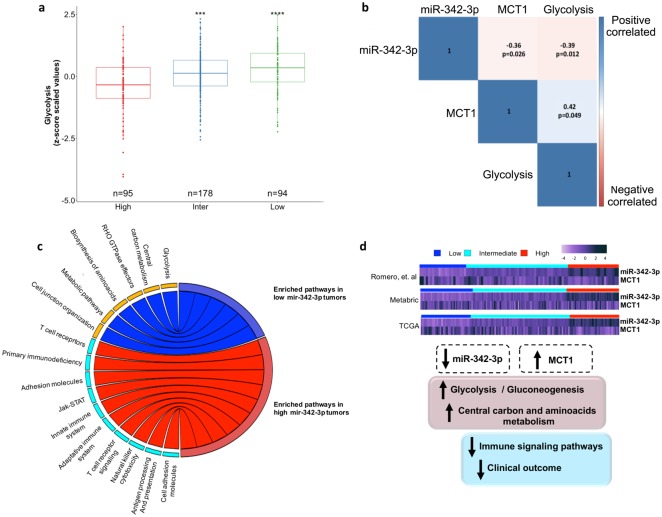
TN tumors expressing low levels of miR-342-3p are enriched in glycolysis pathway. (a) Z-score values of single sample GSEA analysis (ssGSEA) based on Glycolysis terms of TN tumors from our cohort, METABRIC and TCGA database stratified by miR-342-3p expression: low (≤1st quantile), intermediate (>1st quantile but <3rd quantile) and high (≥3rd quantile). (b) Correlation between miR-342-3p, MCT1 and glycolysis ssGSEA score (c) Chord plot illustrating the significant enriched pathways terms that are overrepresented in tumors with low miR-342-3p level (blue) and tumors with high miR-342-3p level (red) (tumors from our cohort, TCGA and METABRIC databases) (d) General conclusion of the descriptive genomics of TN tumors in accordance to miR-342-3p expression. Heatmap of the expression of miR-342-3p and its target gene MCT1 in profiled tumors (our cohort, METABRIC and TCGA) divided by miR-342- 3p expression level. The relative abundances of miR-342-3p and MCT1 are inversely based on miR-342-3p expression level.

