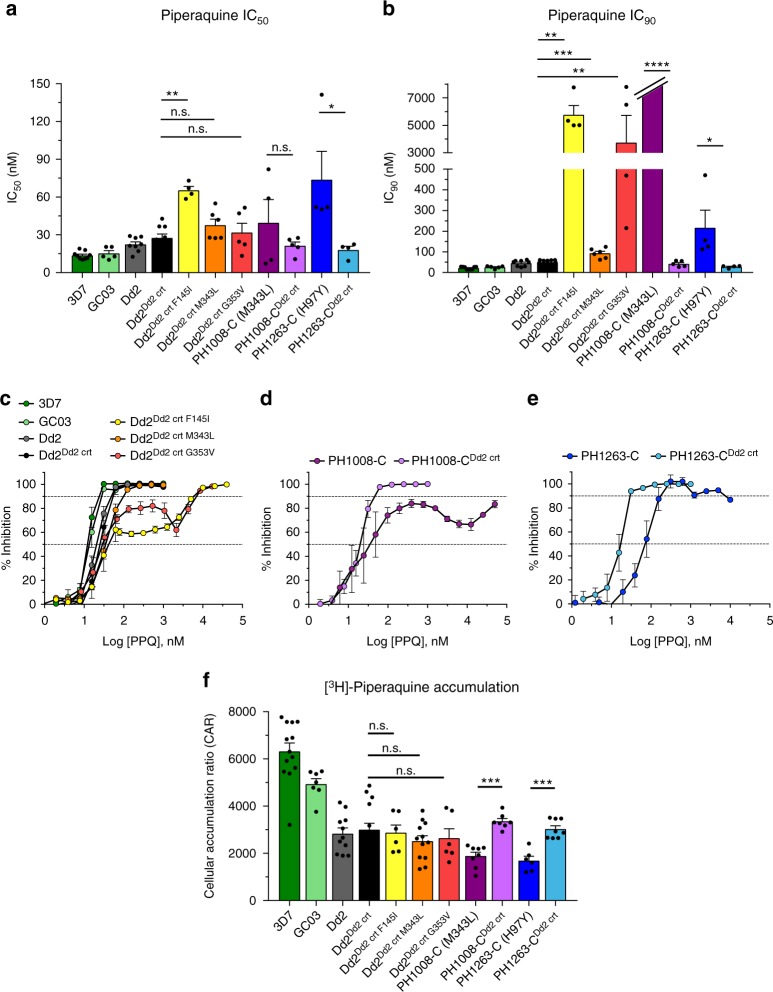
Fig. 3.
PPQ dose–response and accumulation data illustrate distinct variant PfCRT-mediated PPQ resistance profiles. a Mean ± SEM IC50 values were determined from conventional 72-h dose–response assays performed with asynchronous parasite cultures. b Mean ± SEM IC90 data from the same assays. Note that PH1008-C never attained ≥90% inhibition at 50 μM (Supplementary Table 5) and is nominally listed as 7 μM. c–e Dose–response curves for Dd2, PH1008-C, and PH1263-C reference lines and pfcrt-edited clones. The PPQ-sensitive 3D7 and GC03 lines are shown alongside the collection of Dd2 lines as additional sensitive controls. Data show mean ± SEM percent growth inhibition as a function of [PPQ]. These results show the wide variability in dose–response profiles observed with the most highly resistant lines. f Cellular accumulation ratios (CAR), representing the ratio of intracellular to extracellular [3H]-PPQ after 1 h incubation at 37 °C. Assays employed synchronized trophozoites, when the DV is fully formed and hemoglobin degradation is maximal. CAR results for each line are presented as means ± SEMs (N, n = 3 to 7, 2; Supplementary Table 6). a, b, f Significance was determined using Mann–Whitney U tests comparing pfcrt-edited parasites and their isogenic controls. *p < 0.05; **p < 0.01; ***p < 0.001; ****p < 0.0001; n.s. not significant

