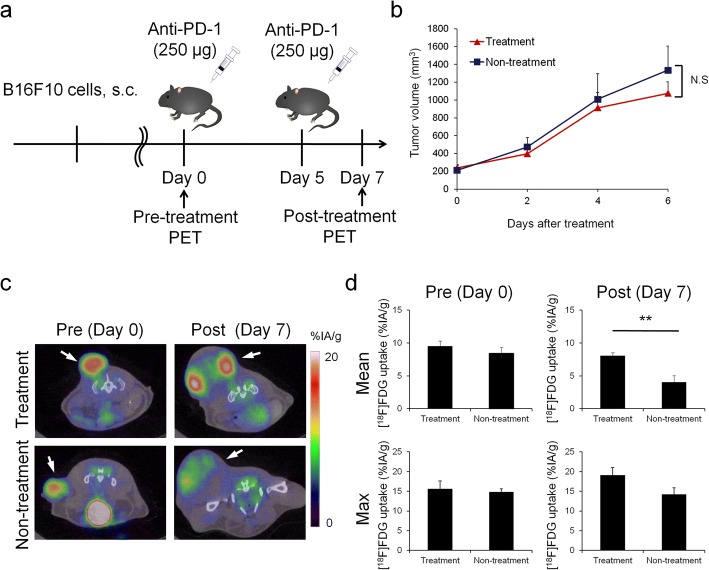
Fig. 1.
a Timeline diagrams for animal studies. b In vivo B16F10 tumor growth curves after anti-PD-1 treatment (n = 25–27). c Coronal sections from [18F]FDG-PET/CT imaging performed on a treated (top) or non-treated (bottom) mouse on day 0 and day 7. d Mean (top) and maximum (bottom) [18F]FDG uptake values in tumor on day 0 and day 7 (n = 5). Data represent mean ± SEM; **P < 0.01; N.S., not significant

