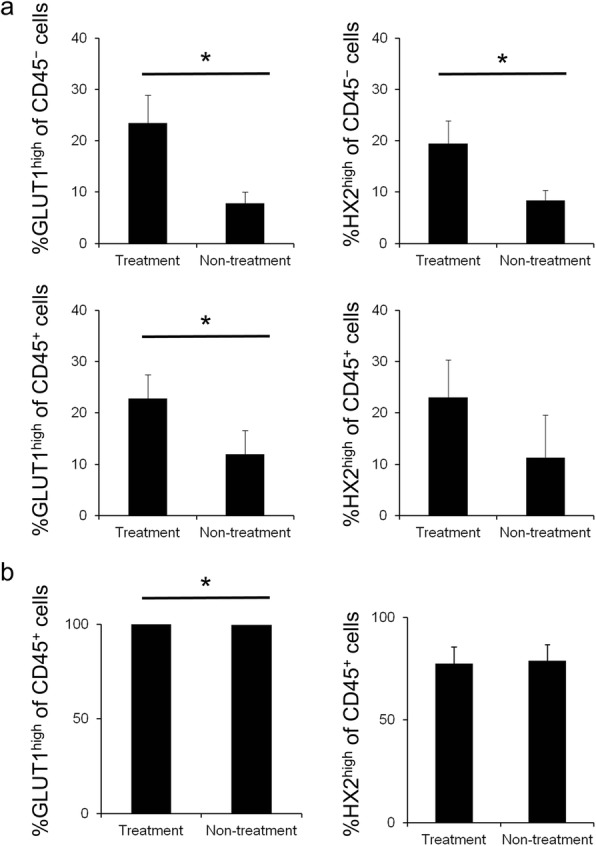
Fig. 4.

Flow-cytometry analysis of metabolism of glucose. a Flow-cytometry analysis of high expression cells of glucose metabolism markers; GLUT1 (left) and hexokinase II (right). Values represent percentage of CD45− cancer cells (top) or CD45+ immune cells (bottom) in tumor on day 7 (n = 6). b Flow-cytometry analysis of high expression cells of glucose metabolism markers; GLUT1 (left) and hexokinase II (right) of CD45+ immune cells in spleen on day 7 (n = 6). Data represent mean ± SEM; *P < 0.05
