FIGURE 1.
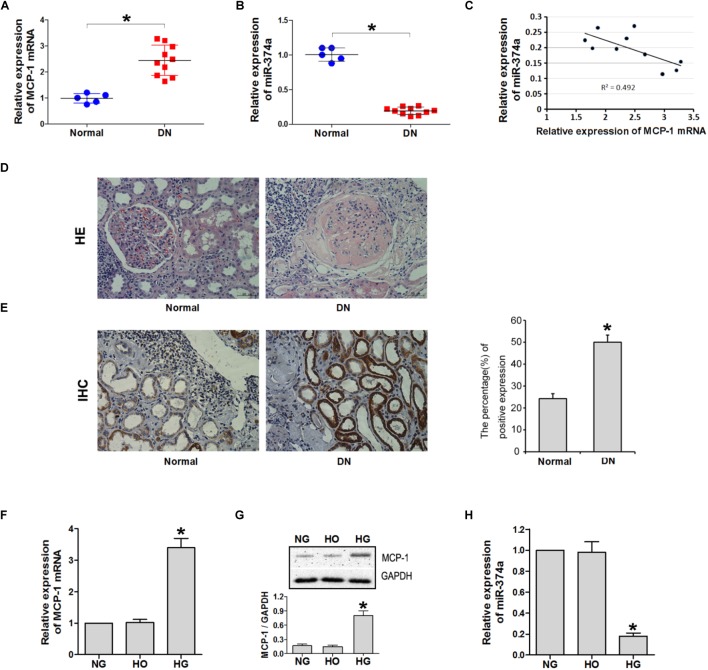
MCP-1 and miR-374a expression in DN tissues. qRT-PCR analysis of MCP-1 mRNA (A) and miR-374a (B) levels in DN tissues. (C) Spearman’s correlation analysis demonstrating an inverse correlation between miR-374a and MCP-1 mRNA levels. ∗P < 0.05. (D) Histological analysis of normal (n = 5) and DN (n = 10) tissues, as determined by HE staining. (E) Upregulation of MCP-1 in DN tissue, as determined by immunohistochemistry. HG induced MCP-1 but suppressed miR-374a in HK2 cells. (F) qRT-PCR and (G) western blot analysis of MCP-1 expression in HK2 cells treated with NG, HG, or HO for 24 h. ∗P < 0.05 vs. NG or HO group (n = 3). (H) miR-374a expression in each group as determined by qRT-PCR. ∗P < 0.05 vs. NG group (n = 3).

