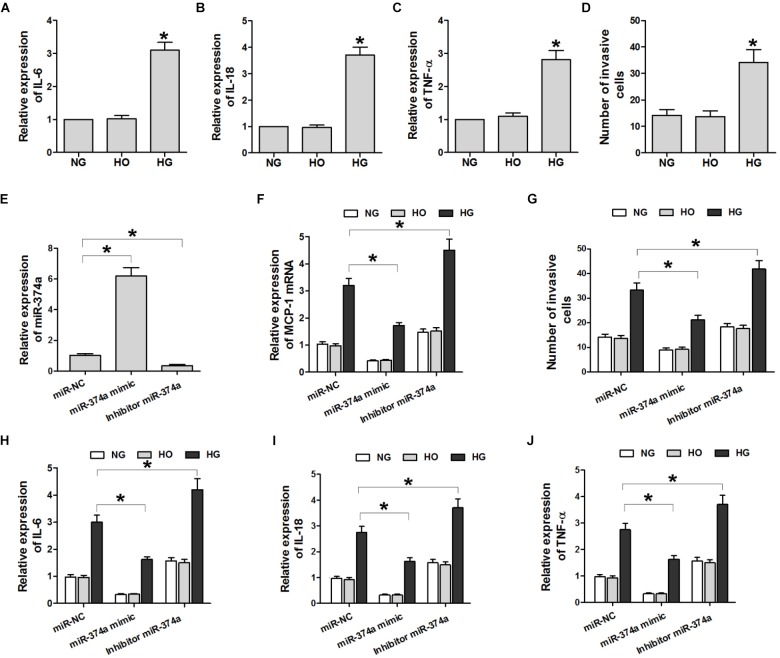
FIGURE 3.
HG induces U937 cell migration and inflammatory cytokine expression through miR-374a. (A–C) ELISA analysis of IL-6 and -18 and TNF-α in the culture supernatant. ∗P < 0.05 vs. NG group (n = 3). (D) Quantitative analysis of U937 cell migration in different groups. ∗P < 0.05 vs. NG or HO group (n = 3). (E,F) qRT-PCR analysis of miR-374a and MCP-1 mRNA. ∗P < 0.05 vs. negative control (miR-NC) group (n = 3). (G) Quantification of U937 cells with the transwell migration assay. ∗P < 0.05 vs. miR-NC group (n = 3). (H–J) After the transwell migration assay, IL-6 and -18 and TNF-α levels in the culture supernatant of HK2 cells transfected with a miR-374a mimic or inhibitor were monitored. ∗P < 0.05 vs. miR-NC group (n = 3).

