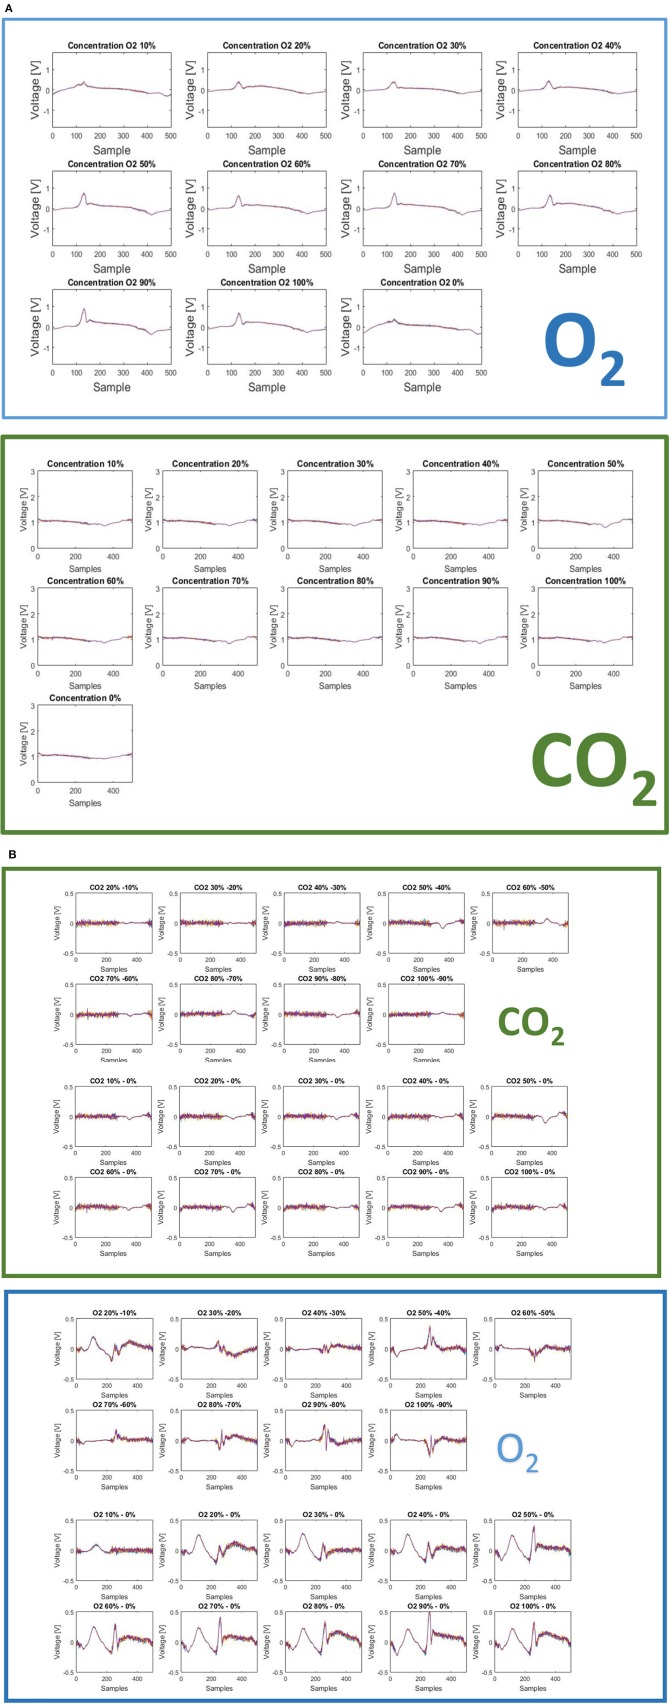
Figure 12.
(A) The fingerprints here presented show two important features of the sensor: (1) measurable differences are present for different concentration level of CO2 and different concentration levels of O2; (2) measurable differences are indeed present for different gases: CO2 and O2. These two aspects account for a useful intra-gas and inter-gas fingerprint variability, which permits gas identification and calibration. (B) Difference of finger printings among different responses to gas concentration [CO2 green panel (above), O2 blue panel (below)].

