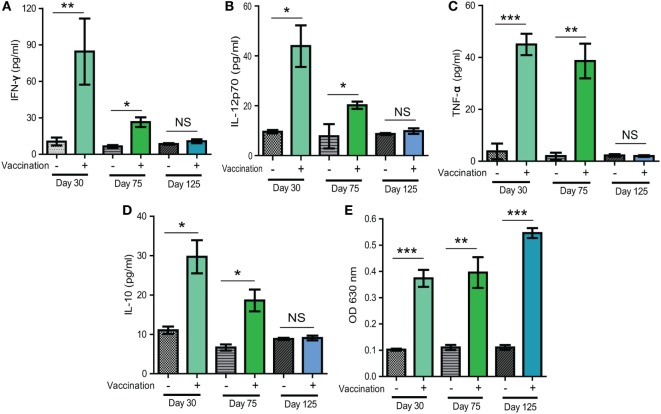
Figure 6.
Levels of selected cytokines and Toxoplasma specific IgG in sera of mice 30, 75, and 125 days after Δldh immunization. (A–D) Levels of indicated cytokines measured by ELISA. (E) Relative levels of Toxoplasma specific IgG, as determined by indirect ELISA. Sera from naïve mice were used as controls and three mice from each group were analyzed. *p < 0.05, **p < 0.01, ***p < 0.001, NS: not significant, Student’s t-test.

