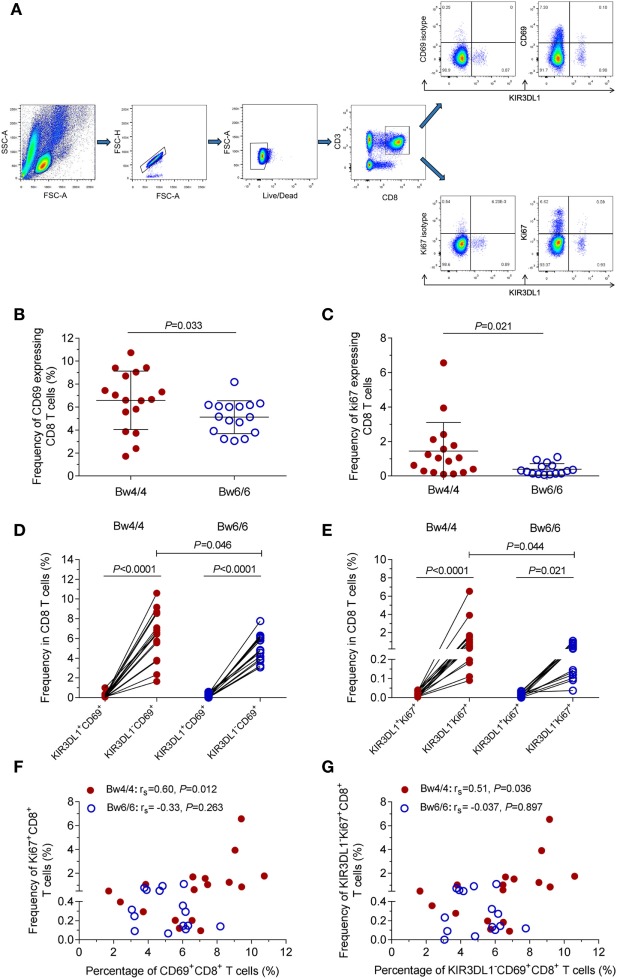
Figure 4.
Early activation and proliferation of CD8 T cells in individuals with different HLA-B serological genotypes. (A) Gating strategy for flow cytometric analysis of CD69 and Ki67 expression on CD8 T cells; (B) early activation capacity of CD8 T cells; (C) proliferation capacity of CD8 T cells; (D) proportion of KIR3DL1+CD69+ cells and KIR3DL1−CD69+ cells in total CD8 T cells; (E) proportion of KIR3DL1+Ki67+ cells and KIR3DL1−Ki67+ cells in total CD8 T cells. Relationship between the early activation and proliferation capacity of total CD8 T cells (F) and KIR3DL1−CD8+ T cells (G). Comparisons between two groups were performed with unpaired Student’s t-tests, and correlations between two variables were analyzed in Spearman’s rank correlation tests, with P < 0.05 considered significant.

