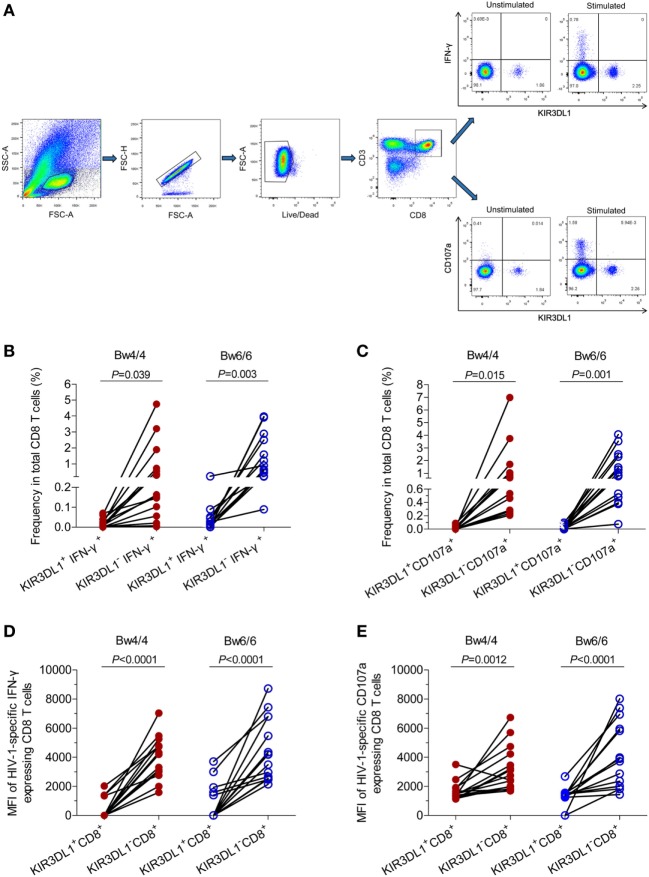
Figure 5.
Median fluorescence intensity and levels of human immunodeficiency virus type 1 (HIV-1)-specific IFN-γ and CD107a produced by CD8 T cells, in Bw4 and Bw6 homozygotes. (A) Gating strategy for flow cytometric analysis of IFN-γ and CD107a expressing in CD8 T cells; (B) frequency of KIR3DL1+IFN-γ+ cells and KIR3DL1−IFN-γ+ cells among total CD8 T cells stimulated with HIV-1 p24 peptides; (C) frequency of KIR3DL1+CD107a+ and KIR3DL1−CD107a+ cells among total CD8 T cells stimulated with HIV-1 p24 peptides. The difference in median fluorescence intensity for the HIV-1-specific IFN-γ (D) and CD107a (E) released by KIR3DL1+CD8+ and KIR3DL1−CD8+ T cells. The Bw4/4 and Bw6/6 motifs are shown in red and blue, respectively. Paired Student’s t-tests were used to compare groups, with P < 0.05 considered significant.

