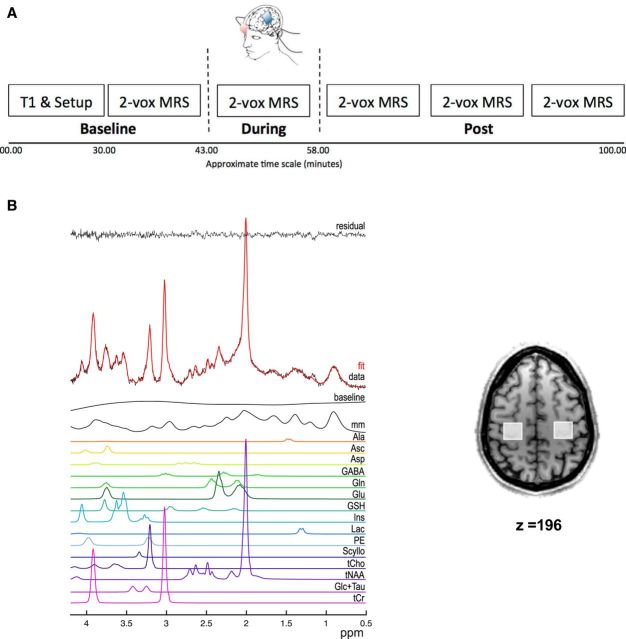
Figure 1.
A, Schematic outlining the protocol of the 7 T MRS sessions. B, Representative spectrum from one acquisition block from one voxel, as analyzed by LCModel, showing the raw data (red) as well as the individual metabolite fits (colored lines) and the residual noise (black). Inset shows the location of both voxels from which MRS was acquired.

