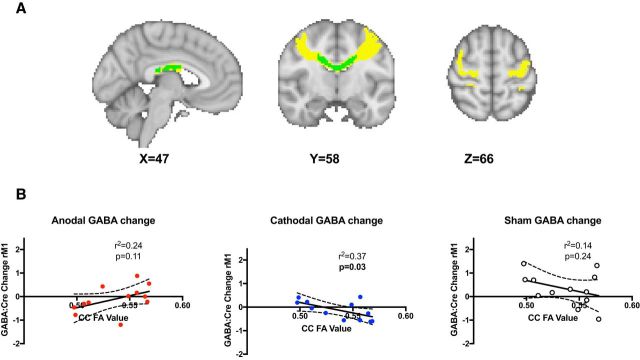
Figure 3.
A, M1–M1 CC mask. The M1–M1 tract is shown in yellow and the M1–M1 CC in green. B, Cathodal tDCS-induced GABA change within right M1 correlates with FA in the M1–M1 CC mask. No significant relationship between M1–M1 CC FA and change in GABA in right M1 was demonstrated during either anodal or cathodal tDCS.

