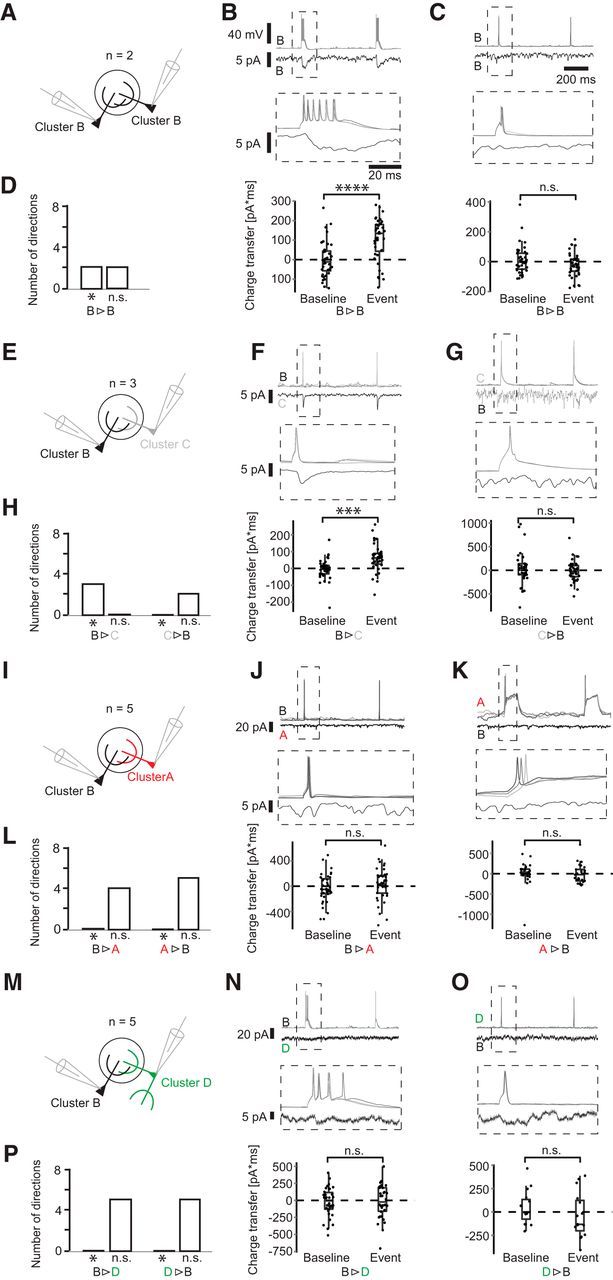
Figure 5.

Synaptic connections of Cluster B neurons. A, Schematic of simultaneous recordings of the configuration B-B. B, C, Short, high-amplitude current injections elicited APs in the first cell, and the corresponding current was monitored in voltage clamp. Here, current averages are shown. Middle column represents blowup of the ROI. Bottom column represents charge transfer during a 50 ms interval after spike onset compared with a randomly drawn baseline. D, Histogram represents the number of significant and nonsignificant responses in each pair configuration in both directions. Asterisk indicates significance *p ≤ 0.05; ***p ≤ 0.001; ****p ≤ 0.0001; paired t test, for exact values, see https://figshare.com/s/7da895122de6ea83e655). E–P, Paired recordings of configurations B-C, B-A, and B-D.
