
Figure 3.
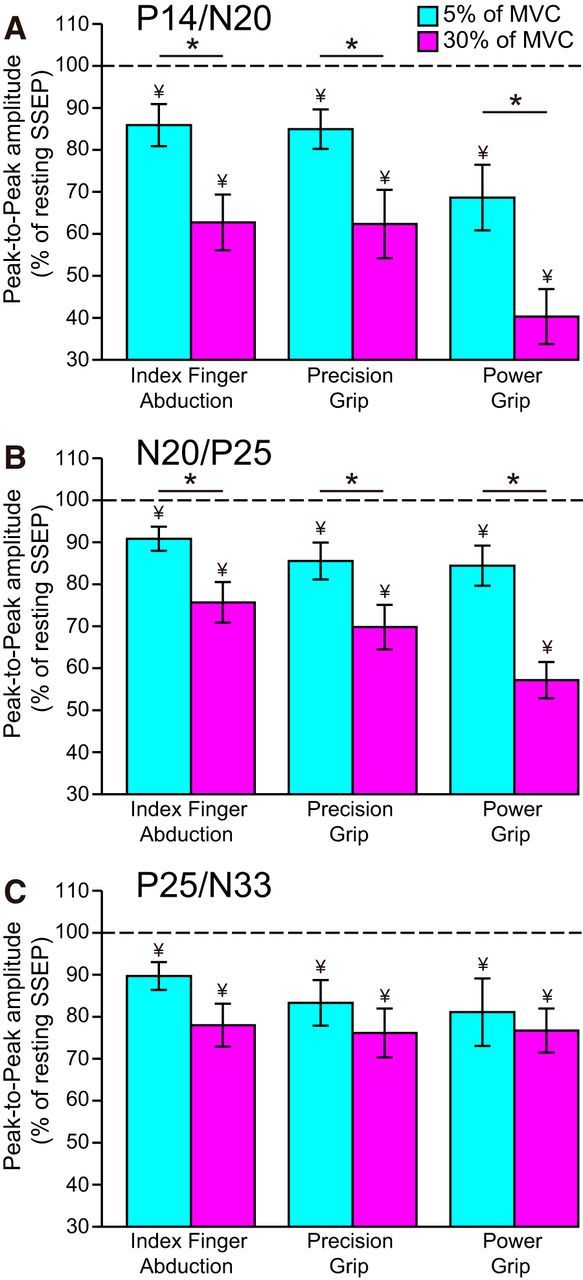
SSEP amplitude. Group data show the amplitude of P14/N20 (A), N20/P25 (B), and P25/N33 (C) SSEP components (expressed as percentage of resting SSEP) during index finger abduction, precision, and power grip at 5% (teal) and 30% (pink) of MVC. Horizontal dotted line indicates the amplitude of the SSEP components at rest. Error bars indicate SE. *p < 0.05, comparison between 5% and 30% of MVC. ¥p < 0.05, comparison between rest and contraction.