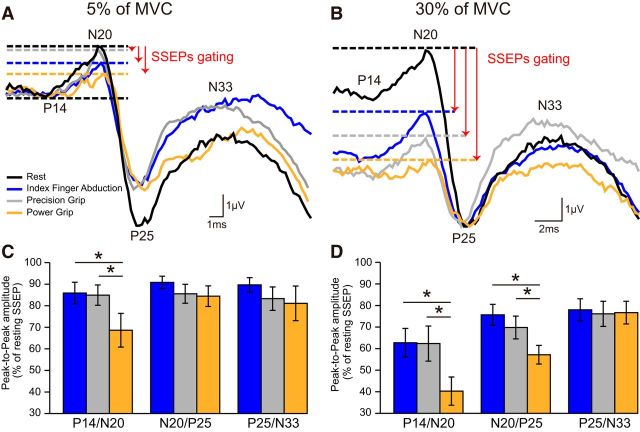
Figure 4.
SSEPs during 5% and 30% of MVC. Raw SSEP traces recorded from the S1 in a representative subject when the right FDI was at rest (black) or performed index finger abduction (blue), precision (gray), and power grip (orange) at 5% (A) and 30% (B) of MVC. Each waveform represents the average of 300 SSEPs. Group data show the amplitude of all SSEP components (expressed as percentage of resting SSEPs) during index finger abduction (blue), precision (gray), and power grip (orange) at 5% (C) and 30% (D) of MVC. Error bars indicate SE. *p < 0.05, comparison between motor tasks.

