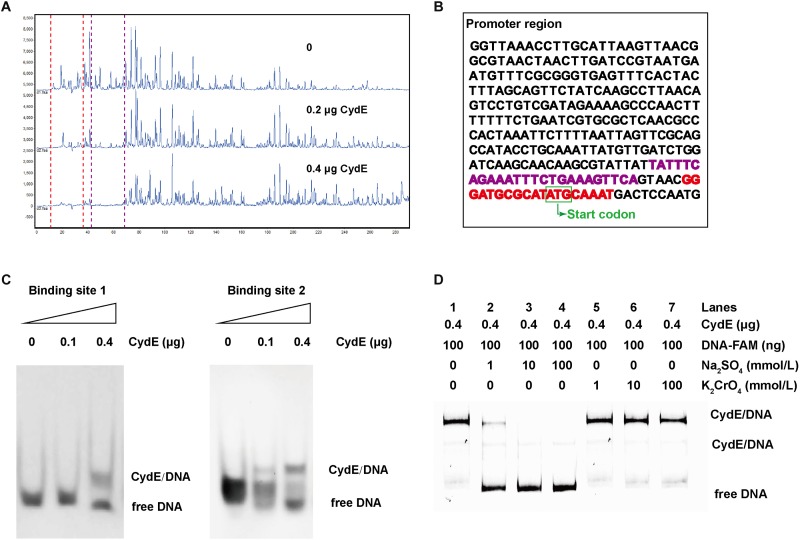
FIGURE 6.
CydE binding sites and derepression analysis. (A) DNA footprinting. FAM-labeled DNA was the same as used in the EMSA and it was incubated with CydE in various amounts. Electropherograms indicated the protection pattern of DNA in different concentrations of CydE. (B) The promoter sequence of cydE. The red and purple highlighted sequences are binding sites 1 and 2, respectively. (C) EMSA for verification of the binding sites of CydE in the promoter region of cydE. The DNA of binding sites 1 and 2 sequences was synthesized and then incubated with CydE protein. The result showed that both the binding sites were shifted after adding CydE. (D) Derepression analysis. The free DNA band is shown with the addition of Na2SO4, while no similar phenomenon was observed with K2CrO4.

