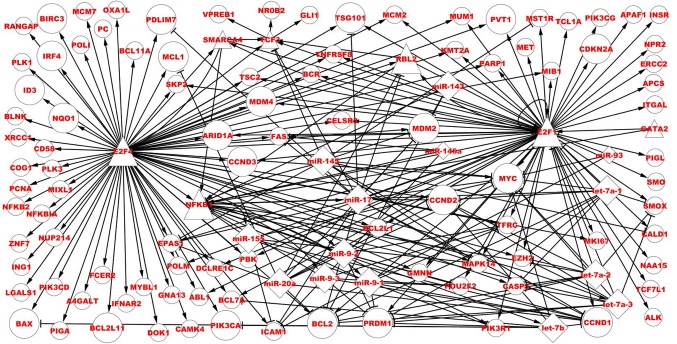
Figure 4.
Direct regulatory associations of E2F1, NFKB1, E2F4 and TCF3 in the BL-associated network. Bigger nodes represent dysregulated TFs, miRNAs and targets, smaller nodes represent associated and non-dysregulated TFs, miRNAs and target genes. Circles represent targets, triangles represent TFs and diamonds represent miRNAs. TF, transcription factors; E2F1, E2F TF1; NFKB1, nuclear factor κB subunit 1; TCF3, TF3; miR, microRNA; BL, Burkitt lymphoma.

