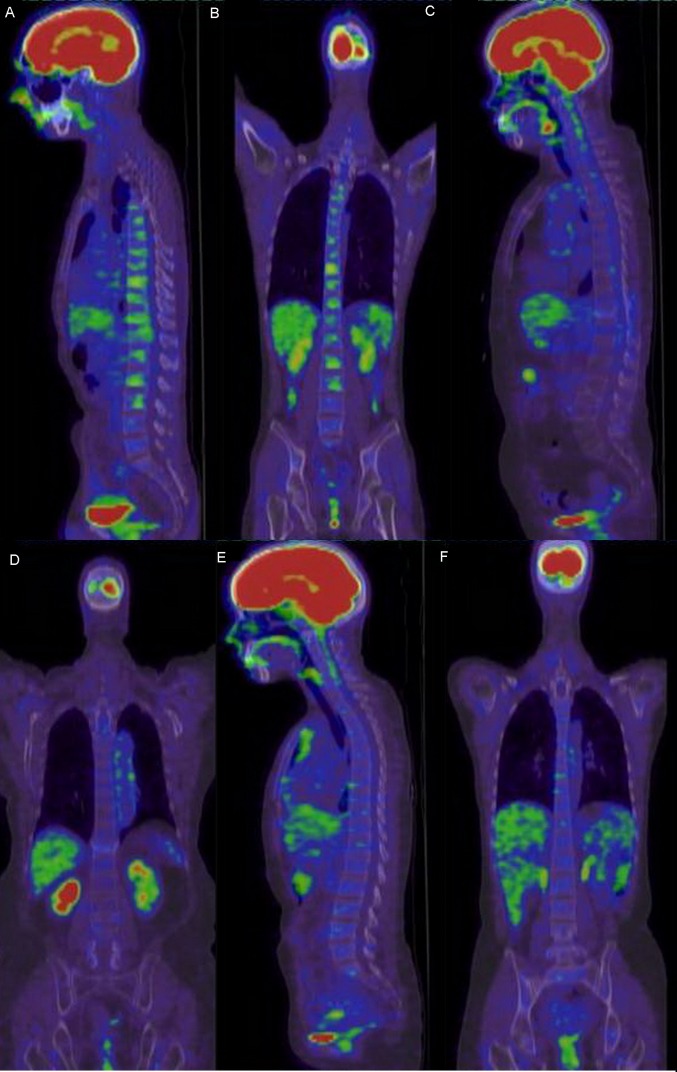
Figure 2.
PET/CT scans of patients with AA. (A) Coronal and (B) sagittal images of patients with AA with diffuse hypometabolism complicated by focal hypermetabolism and increased uptake in systemic PET/CT. (C) Coronal and (D) sagittal images of patients with AA with generalized bone marrow hypometabolism in systemic PET/CT. (E) Coronal and (F) sagittal images of patients with AA with normal metabolism. PET, positron emission tomography; CT, computed tomography; AA, aplastic anemia.

