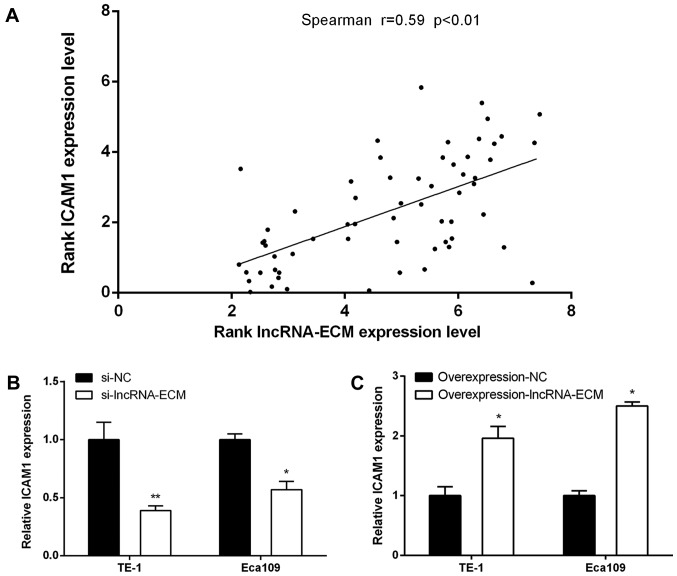
Figure 6.
Correlation analysis between lncRNA-ECM and ICAM1. (A) Positive correlation between lncRNA-ECM and ICAM1 in ESCCs. (B) Following knock-down of lncRNA-ECM the level of ICAM1 decreases. (C) Following overexpression of lncRNA-ECM the level of ICAM1 increased. *P<0.05 and **P<0.01 vs. the NC group. Lnc, long-non coding; ECM, extracellular matrix; ICAM1, intercellular adhesion molecule 1; NC, negative control.

