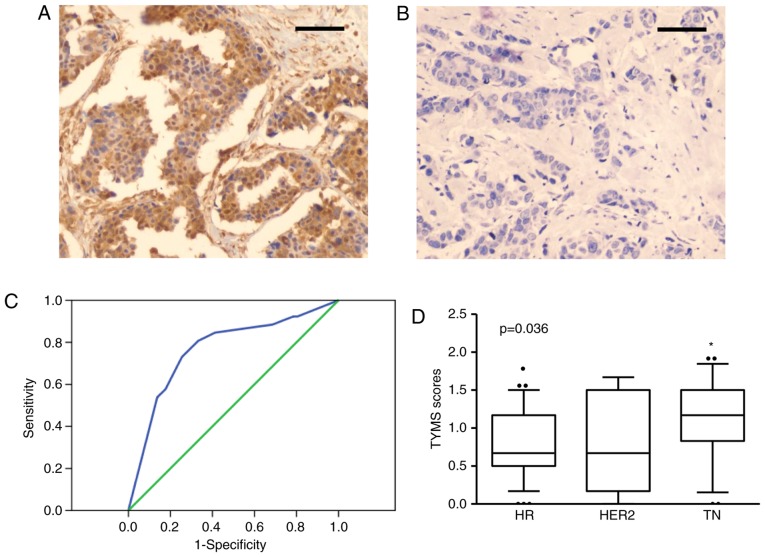
Figure 1.
TYMS expression in breast cancer specimens. (A and B) IHC staining of TYMS in breast cancer tissues. Representative image of (A) TYMS-high and (B) -low expression were shown. Bar, 50 µm. (C) Cut-off value of TYMS scores was analyzed with ROC. Cut-off Score=1.09, AUC=0.768, P<0.001, 95% CI, 0.651-0.886. (D) TYMS scores comparation between different subtypes of breast cancer tissues: HR positive (HR), HER2 positive (HER2) and triple negative (TN) ones. Data were analyzed with Fisher's exact test. P=0.036. *P<0.05 vs group HR or HER2. TYMS, thymidylate synthase; HR, hormone receptor; HER2, human epidermal growth factor receptor 2.

