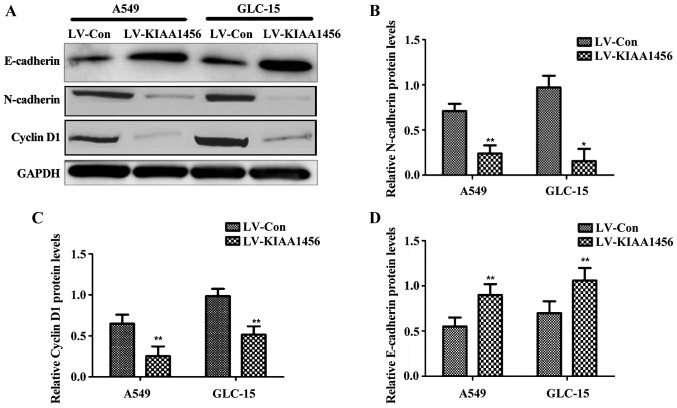
Figure 3.
Changes in expression levels of N-cadherin, cyclin D1 and E-cadherin after overexpression of KIAA1456 in A549 and GLC-15 cells. (A) Based on western blotting, after overexpression of KIAA1456, A549 and GLC-15 cells have evidently increased E-cadherin protein expression levels and significantly decreased N-cadherin and cyclin D1 expression levels in comparison with control. (B) N-cadherin expression level; (C) cyclin D1 expression level; and (D) E-cadherin expression level. Compared with LV-Con, *P<0.05; compared with LV-Con, **P<0.01.

