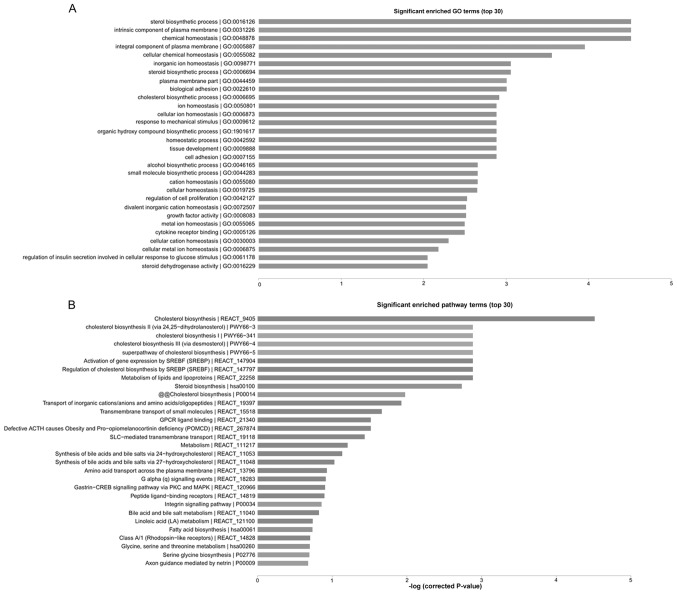
Figure 3.
(A) Enrichment scores of the significantly enriched GO terms for differentially expressed mRNAs. (B) Enrichment scores of the significantly enriched pathway terms for differentially expressed mRNAs. The vertical axis represents the pathway category and the horizontal axis represents the enrichment score [-log10 (P-value)] of the pathway. GO, gene ontology.

