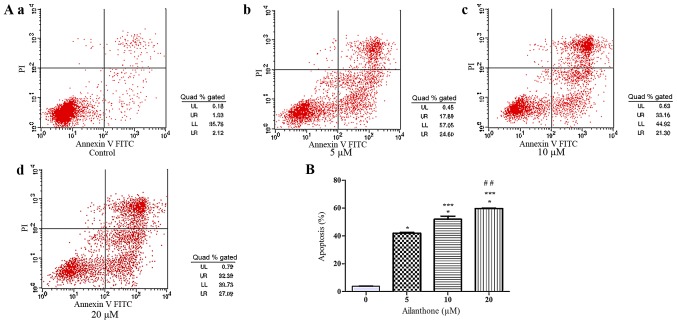
Figure 2.
Ailanthone induced apoptosis in HL-60 cells. (A) Ailanthone induced apoptosis in HL-60 cells, which were stained by annexin V-APC/7-AAD fluid and assessed using flow cytometry analysis. (a) Control cells; Cells treated with (b) 5, (c) 10, and (d) 20 µM ailanthone for 48 h at 37°C, respectively. Lower left (LL) quadrants: Viable cells. Lower right (LR) quadrants: Early apoptotic cells. Upper right (UR) quadrants: Late apoptotic cells. Upper left (UL) quadrants: Nonviable cells. (B) The data showed that ailanthone increased the percentage of apoptotic cells in a dose-dependent manner, ANOVA using Newman-Keuls multiple comparison test. *P<0.05 vs. control, ***P<0.05 vs. 5 µM groups, ##P<0.05 vs. 10 µM groups.

