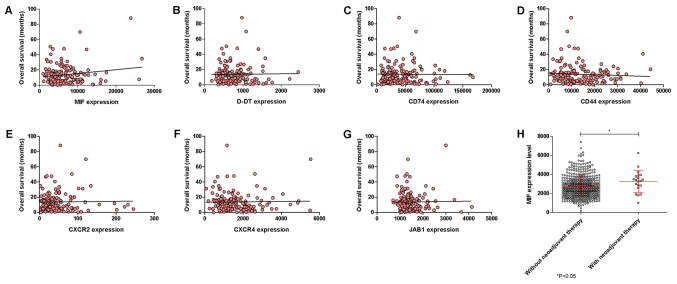
Figure 2.
Correlation between overall survival and expression levels (A) MIF, (B) D-DT, (C) CD74, (D) CD44, (E) CXCR2, (F) CXCR4 and (G) JAB1 was performed using linear regression analysis and Pearson's test on glioblastoma samples. (H) Differences in MIF expression levels were calculated in glioblastoma samples from drug-naïve patients and patients who underwent neoadjuvant therapy. Data were retrieved from the The Cancer Genome Atlas dataset through the cBioportal web-based utility (cbioportal.org). *P<0.05, as indicated. MIF, macrophage migration inhibitory factor; D-DT, D-dopachrome tautomerase; CD, cluster of differentiation; CXCR, C-X-C Motif Chemokine Receptor; JAB1, c-Jun activation domain-binding protein-1.

