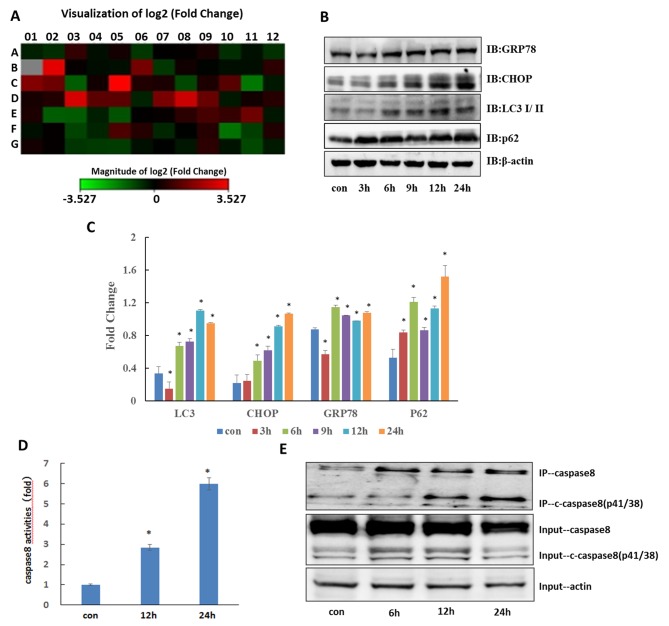
Figure 3.
Autophagy inhibitor CQ induces ER stress in QBC939 cells. (A) QBC939 cells were treated with 50 µM CQ for 6 h and the expression of 84 ER stress-associated genes was examined using a Human Unfolded Protein Response PCR Array. Changes are presented as heat images where green indicates downregulation and red indicates upregulation. Grey represents no value obtained. Data are derived from three experiments. (B) Cells were treated with CQ and expression of HSPA5, CHOP, LC3 and p62 was analyzed by western blotting. (C) Results of quantitative analysis of Fig. 3B. *P<0.05 vs. control. (D) Cells were analyzed using a caspase-8 activity assay. Data are presented as mean ± standard deviation, n=3. *P<0.05 vs. control. (E) QBC939 cells were treated with 50 e-8 activity assay. Data are presented as mean ± indicates upregulation ubiquitination, translocation anti-caspase 8 antibody. HSPA5, heat shock protein family A (Hsp70) member 5; CHOP, C/EDP homologous protein; LC3, microtubules associated protein light chain 3; CQ, chloroquine.

