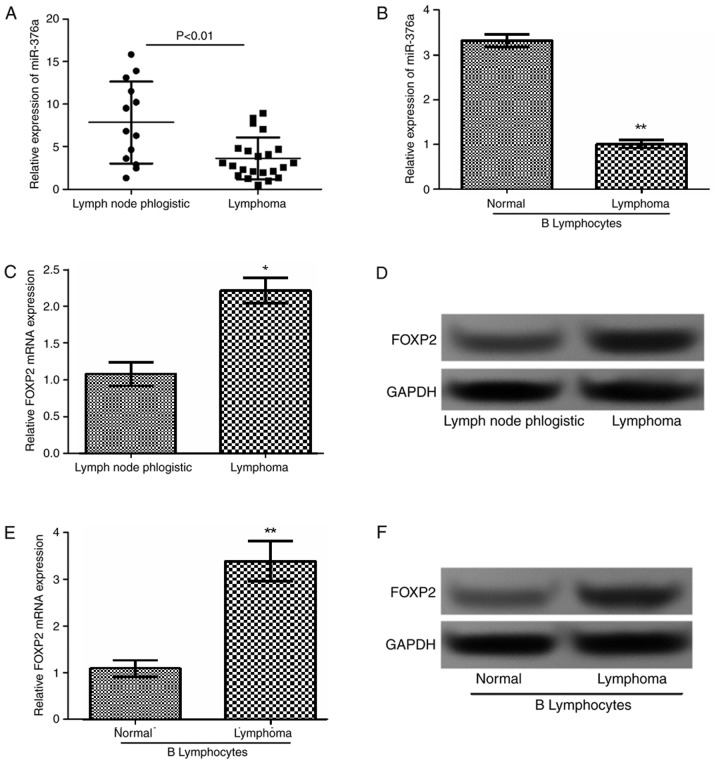
Figure 1.
Expression of miR-376a in lymphoma tissue and cells. The relative expression levels of miR-376a in (A) lymphoma tissues and (B) cell lines detected by RT-qPCR. The relative expression levels of FOXP2 in lymphoma tissues detected by (C) RT-qPCR and (D) western blot analysis. The relative expression levels of FOXP2 in lymphoma cells detected by (E) RT-qPCR and (F) western blot analysis. Data were expressed as mean ± standard deviation. *P<0.05 and **P<0.01 vs. control. miR-376a, microRNA-376a; RT-qPCR, reverse transcription quantitative polymerase chain reaction; FOXP2, forkhead box protein P2.

