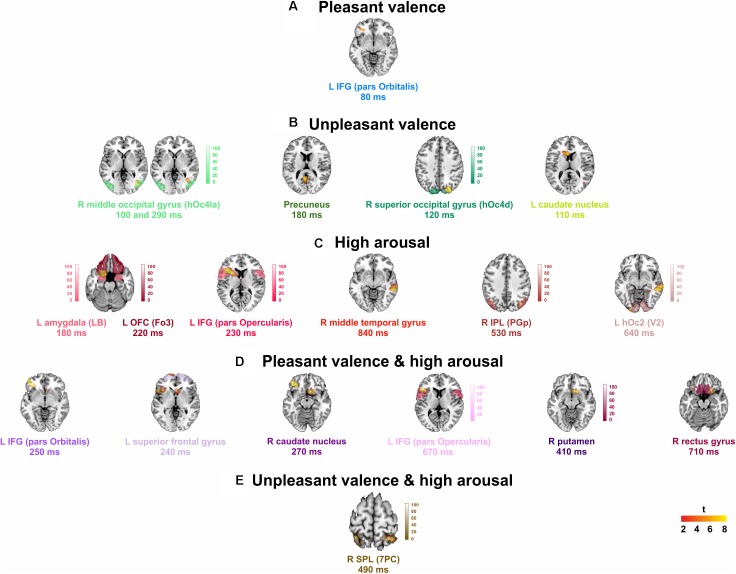
FIGURE 2.
Group analysis activations at their peak for: (A) pleasant, and (B) unpleasant valence, (C) high arousal stimuli, and (D) pleasant, and (E) unpleasant valence interaction to high arousal. L, left; R, right. Points counted as left or right were at least 6 mm from the midline. Red to yellow color scale, t-values. Threshold: AlphaSim corrected at p < 0.05 by taking into account the significance threshold, p < 0.001 uncorrected, and cluster size (threshold size, 157 voxels). Significant activations are overlaid by the corresponding cytoarchitectonic regions (when available).

