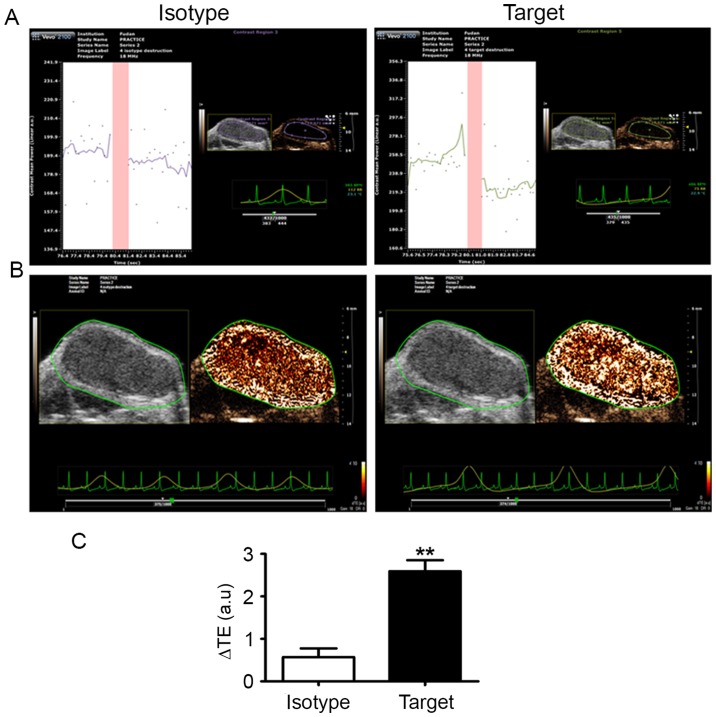
Figure 2.
Isotype and endoglin-targeted ultrasound molecular imaging of a nude mouse with subcutaneous HB. (A) Intensity graph for the traced regions of interest prior to and after the destruction pulse (pink region). The region on the left of the column is prior to destruction, and on the right of it is after destruction. The change in intensity following the destruction pulse is an index of the amount of specific binding. The linearized signal prior to the destruction pulse represents bound and circulating microbubbles (MB) and tissue signal. The linearized signal after the destruction pulse corresponds to the MB that were still in circulation and to any residual tissue-echoes, and does not represent the binding process. The ΔTE was computed by subtracting the mean intensity detected after the destructive pulse from that prior to the destructive pulse. (B) Parametric imaging. The scale bar of ΔTE is on the right corner of the map. (C) ΔTE of isotype and endoglin-targeted MB. ΔTE = TEfd - TEpd. n=4; **P<0.001. TE, targeted enhancement; ΔTE, differential TE; fd, following destruction; pd, prior to destruction; MB, microbubbles.

