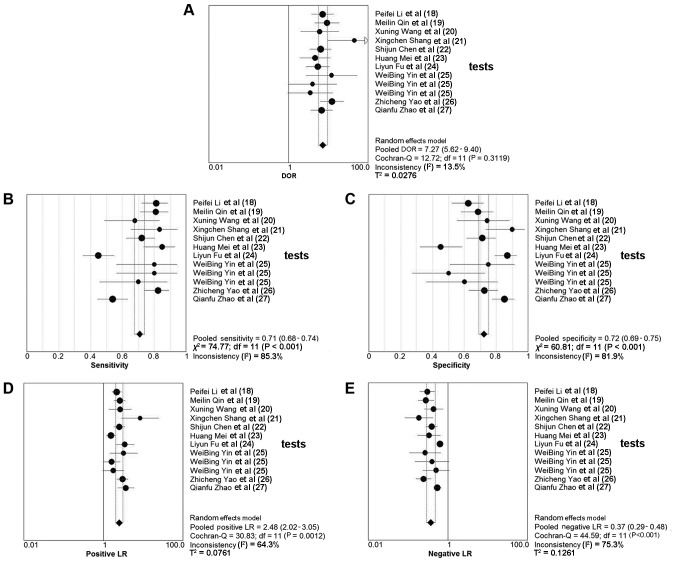
Figure 3.
Forests plot of the accuracy of circRNAs for the diagnosis of cancer. (A) DOR forest plot of the circRNAs. (B) Sensitivity forest plot of the circRNAs. (C) Specificity forest plot of the circRNAs. (D) Positive LR forest plot of the circRNAs. (E) Negative LR forest plot of the circRNAs. DOR, diagnostic odds ratio; LR, likelihood ratio; circRNAs, circular RNAs; df, degrees of freedom.

