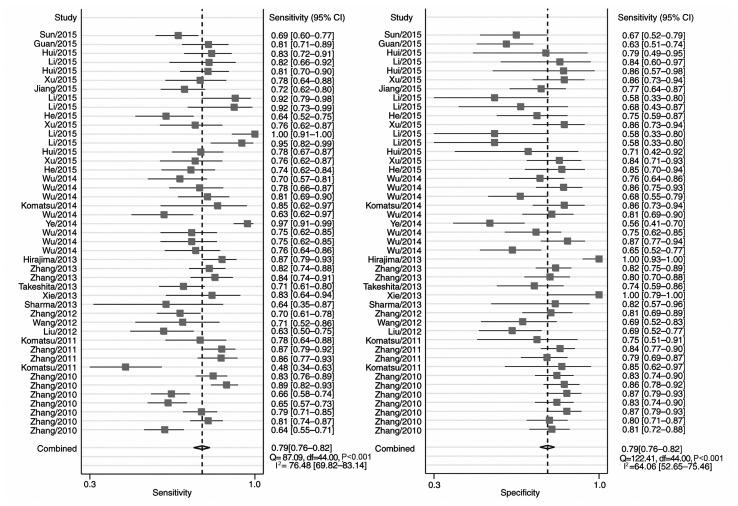
Figure 2.
Forest plot of the pooled sensitivity and specificity of microRNAs in the detection of esophageal cancer. The squares and horizontal lines reflect the study-specific sensitivity and specificity estimates and their corresponding 95% CIs. The diamonds represent the combined estimate. CI, confidence interval; Q, Choran's Q for heterogeneity; df, degrees of freedom.

