FIGURE 5.
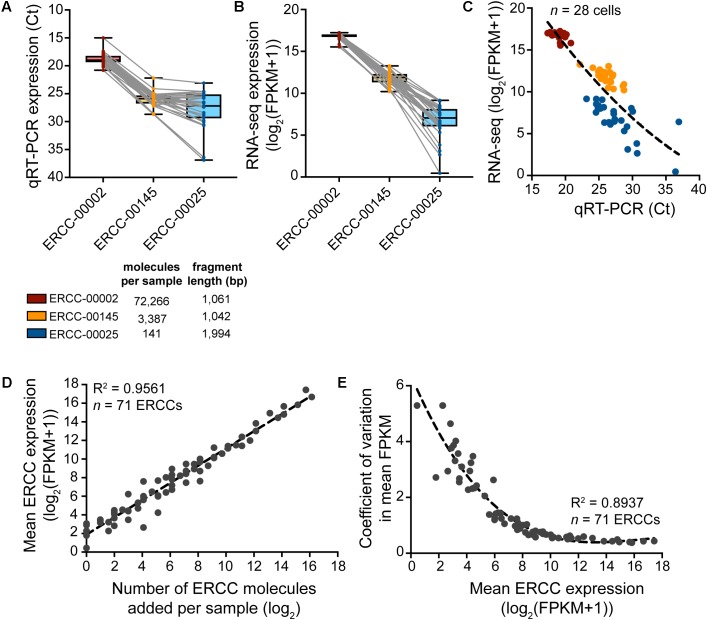
Expression analysis of ERCC RNA spike-in controls to assess technical performance of SMARTer cDNA preparation. (A–C) Expression of a high-, medium-, and low-copy ERCC standard in n = 28 spiked cells measured by qRT-PCR and RNA-seq. Variability in expression increases with a decrease in absolute ERCC copy number. (D) Measured expression of ERCC RNA spike-ins as a function of the number of actual molecules added to each sample. The very small amount (∼10 pg) of RNA in a single cell requires a significant dilution of the ERCC stock to avoid overspiking of the experimental sample with exogenous transcripts. With a 1:5,000,000 dilution in the final master mix before reverse transcription, 73 ERCCs were present in at least one copy number, 71 of which were detected by RNA-seq across samples (n = 28). (E) The variation in measured ERCC expression levels is highest for low expressed (i.e., low abundant) ERCCs.

