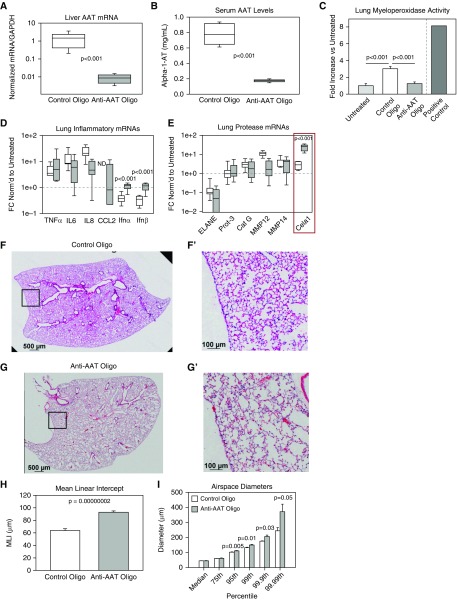
Figure 4.
Mouse model of alpha-1 antitrypsin (AAT) deficiency–related lung disease (AAT-RLD). (A) Compared with control oligonucleotide, anti-AAT oligonucleotide administration reduced liver AAT concentrations by more than 99% 8 days after administration of the final dose. Note the logarithmic scale and nonparametric data (n = 8 per group, comparison by Mann-Whitney U test). (B) Serum AAT concentrations were reduced in these same animals. (C) Lung myeloperoxidase activity, a measure of neutrophil infiltration, was elevated in control oligonucleotide–treated lungs, but not anti-AAT oligonucleotide–treated lungs, compared with untreated lungs (n = 5). Lung from an animal subjected to intestinal ischemia reperfusion in a previous study (42) was used as a positive control. (D) Left lung inflammatory mRNAs were no different after treatment with anti-AAT and control oligonucleotide. Values were normalized to untreated adult control lung, and samples with undetectable mRNA were assigned a value of zero for statistical analysis. IFN-α and IFN-β mRNA concentrations were elevated in anti-AAT oligonucleotide–treated lungs but comparable to untreated control lungs. P < 0.001 (n = 8 per group). (E) The mRNAs of many genes associated with AAT-RLD were no different in control oligonucleotide–treated and anti-AAT oligonucleotide–treated lungs, but Cela1 mRNA concentrations were increased eightfold. (F and G) A representative lower lung lobe of a wild-type mouse treated with (F) control oligonucleotide and (G) anti-AAT oligonucleotide (E′, F′, and G′ are higher magnification images of respective boxed regions). Scale bars: 500 μm (F and G) and 100 μm (F′ and G′). (H) As assessed by MLI, anti-AAT oligonucleotide treatment (n = 8) significantly increased airspace size compared with control oligonucleotide–treated mice (n = 7) (Student’s t test). (I) Whereas median and 75th percentile alveolar diameters were no different in anti-AAT oligonucleotide– and control oligonucleotide–treated lungs, diameters were significantly larger at percentiles beyond the 95th (Student’s t test), indicating that only the largest airspaces were contributing to the measured difference in MLI. Cat G = cathepsin G; ELANE = neutrophil elastase; FC = fold change; ND = not detected; Prot-3 = protease 3.

