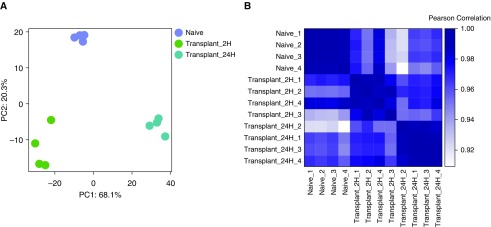
Figure 1.
Assessing inter- and intragroup variability. (A) Principal component (PC) analysis plot displaying all 12 samples along PC1 and PC2, which describe 68.1% and 20.3% of the variability, respectively, within the expression data set. PC analysis was applied to normalized (reads per kilobases of transcript per 1 million mapped reads) and log-transformed count data. (B) Pearson’s correlation plot visualizing the correlation (r) values between samples. Scale bar represents the range of the correlation coefficients (r) displayed.

