Figure 2.
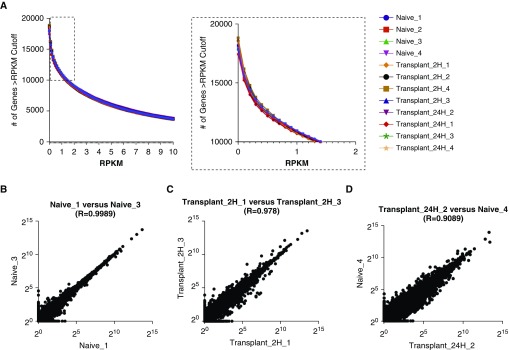
Determining a low count threshold. (A) The number of genes at a given reads per kilobases of transcript per 1 million mapped reads (RPKM) value for each sample (bins = 120; bin size = 0.1). Inset box enlarged at right highlights a subsection of the figure that was used to define an RPKM cutoff of 1 (bin size = 0.1). (B–D) Scatterplots comparing the expression of individual genes between two samples for (B) most correlated samples within a group (r = 0.9989), (C) least correlated samples within a group (r = 0.978), and (D) least correlated samples within the data set (r = 0.9089). Data are plotted on a log2 scale.

