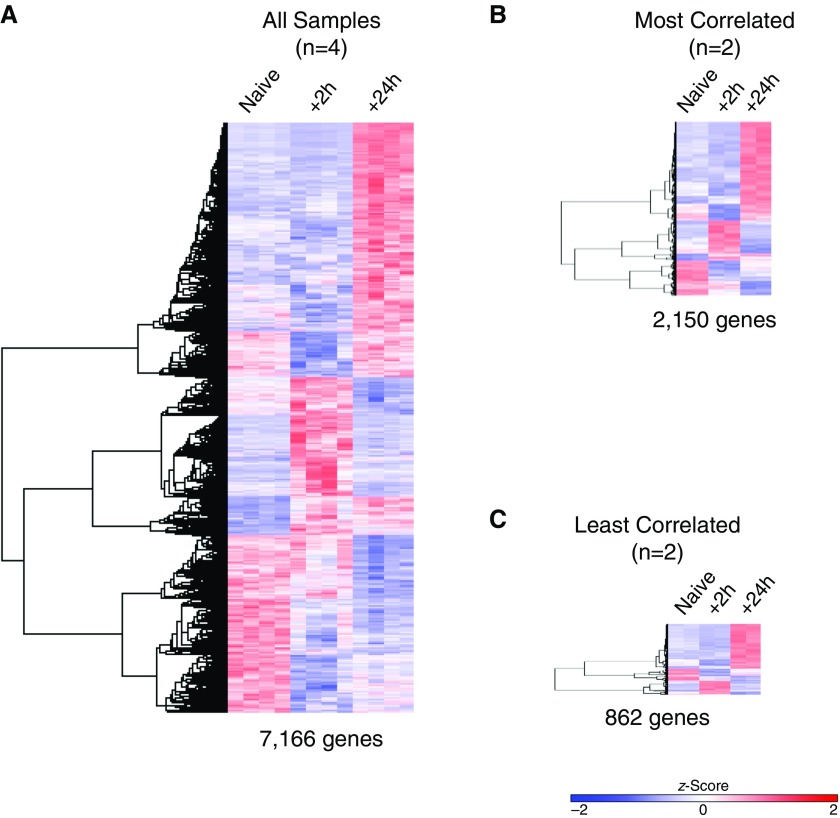
Figure 5.
Effect of group size and intragroup variance on ability to identify gene clusters. Hierarchical clustering performed on differentially expressed genes defined by ANOVA with a false discovery rate less than 0.05. (A) Using all replicates per group, 7,166 genes were clustered. (B) Most and (C) least correlated samples resulted in input lists of 2,150 and 862 genes, respectively. The z-score scale bar represents relative expression ±2 SD from the mean.

