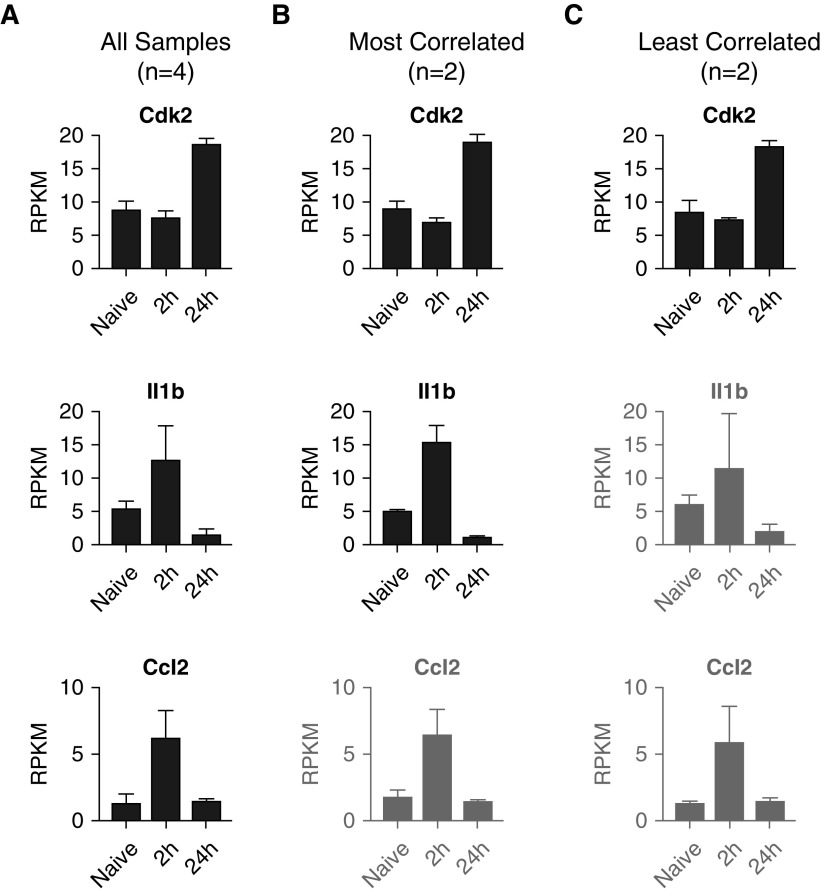
Figure 7.
Individual gene analysis. RPKM expression values for the Cdk2, Il1b, and Ccl2 genes are shown for the datasets containing (A) all samples (n = 4/group), (B) most correlated replicates (n = 2/group), and (C) least correlated replicates (n = 2/group). Although all three genes were identified as differentially expressed genes (DEGs) from the full (n = 4) dataset in Figure 6, Ccl2 was not among the DEGs in the “most correlated” comparison, owing to an ANOVA false discovery rate greater than 0.05, and neither Il1b nor Ccl2 was a DEG in the “least correlated” comparison. Genes that were not DEGs in the designated dataset are displayed in gray.

