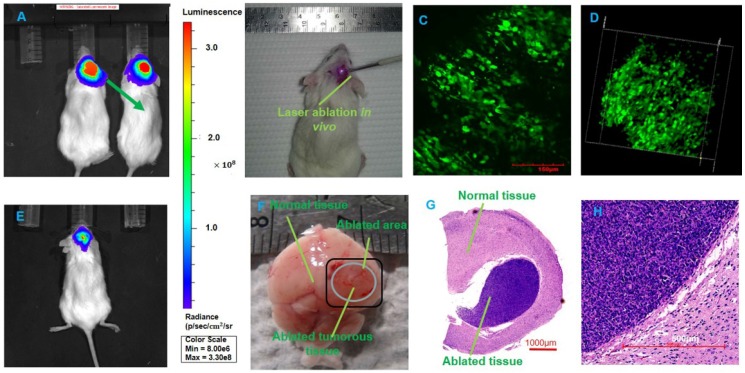
Figure 9.
The TPM imaging after laser ablation. (A, E) The BLI before and post laser ablation in vivo, respectively. (B) In vivo laser ablation. (C-D) In vivo TPM imaging at the location of the tumor boundary with three-dimensional TPM images (scale bar: 150 μm). (F) The whole brain specimens ex vivo (scale bar: 1 mm). (G-H) The histopathological sections of ablated brain specimens (scale bars: 1000 μm and 500 μm, respectively).

