Figure 2.
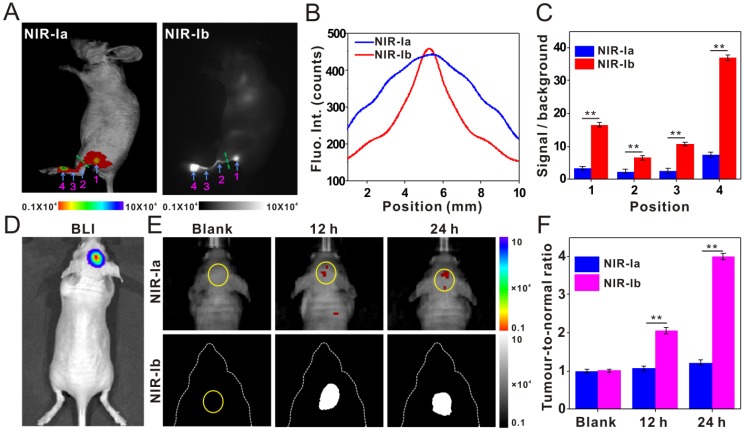
Brain tumour imaging and lymphatic mapping using IR-808. (A) NIR-Ia and NIR-Ib images of mouse hind leg captured at 60 s post-injection. Arrows 1-3 point to sentinel lymph nodes, while arrow 4 points to the injection site. The excitation wavelength was 680 nm for NIR-Ia imaging and was 808 nm for NIR-Ib imaging. A bandpass filter ranged from 700 nm to 900 nm for NIR-Ia imaging and from 900-1,000 nm for NIR-Ib imaging. A fixed exposure time of 1 s was used for NIR-Ia imaging and 200 ms for NIR-Ib imaging. The power density of excitation at the imaging plane was 45 mW/cm2. (B) Cross-sectional fluorescence intensity profiles along the green dashed line as shown in (A). (C) SBR of sentinel lymph nodes and the injection site as shown in (A). (D) Bioluminescence image of the tumour-bearing mouse and (E) NIR-Ia and NIR-Ib images of brain tumours (circled in yellow) at different time points post-injection. (F) TNR of fluorescence images at different time points post-injection.

