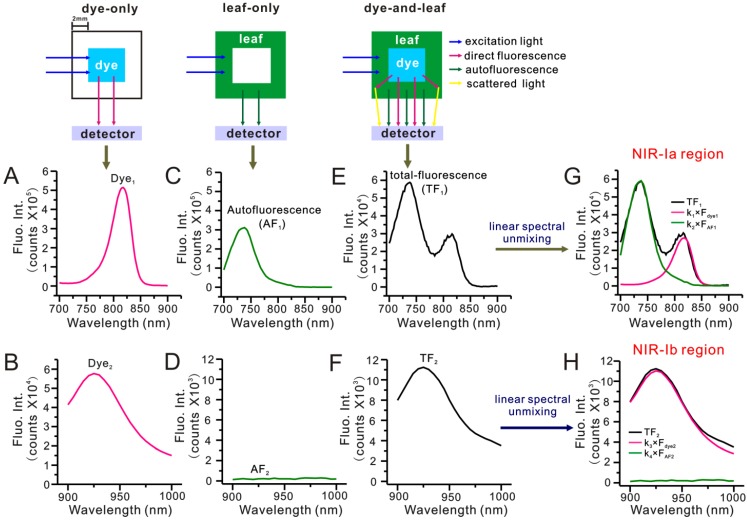
Figure 4.
Simulated leaf experiment for evaluating the impact of autofluorescence on NIR fluorescence imaging. (A) NIR-Ia and (B) NIR-Ib fluorescence spectra of 50 µg/mL IR-808 solution. (C) NIR-Ia and (F) NIR-Ib autofluorescence spectra of 5% leaf homogenate. (E) NIR-Ia and (F) NIR-Ib fluorescence spectra of the simulated leaf prior to linear spectral unmixing. (G) NIR-Ia and (H) NIR-Ib fluorescence spectra of the simulated leaf after linear spectral unmixing. Dye fluorescence and autofluorescence components are highlighted in pink and green, respectively. Excitation and emission slits were set to 5 nm. The power density of excitation was 300 W. The excitation wavelength was 680 nm for NIR-Ia imaging and was 808 nm for NIR-Ib imaging. Fluorescence emission ranged from 700 nm to 900 nm for NIR-Ia imaging and from 900 nm to 1,000 nm for NIR-Ib imaging.

