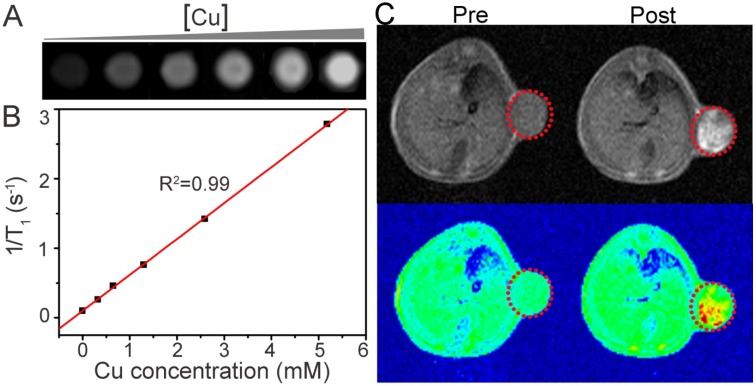
Figure 5.
(A) In vitro T1-weighted MR images of the Cu-TCPP MOF nanosheets with different aqueous dispersion concentrations. (B) Plots of the 1/T1 value of the Cu-TCPP MOF nanosheets as a function of concentration. (C) In vivoT1-weighted MR views of a mouse before and after intratumoral injection of the Cu-TCPP MOF nanosheets solution. The position of the tumor is marked by red dotted circles.

