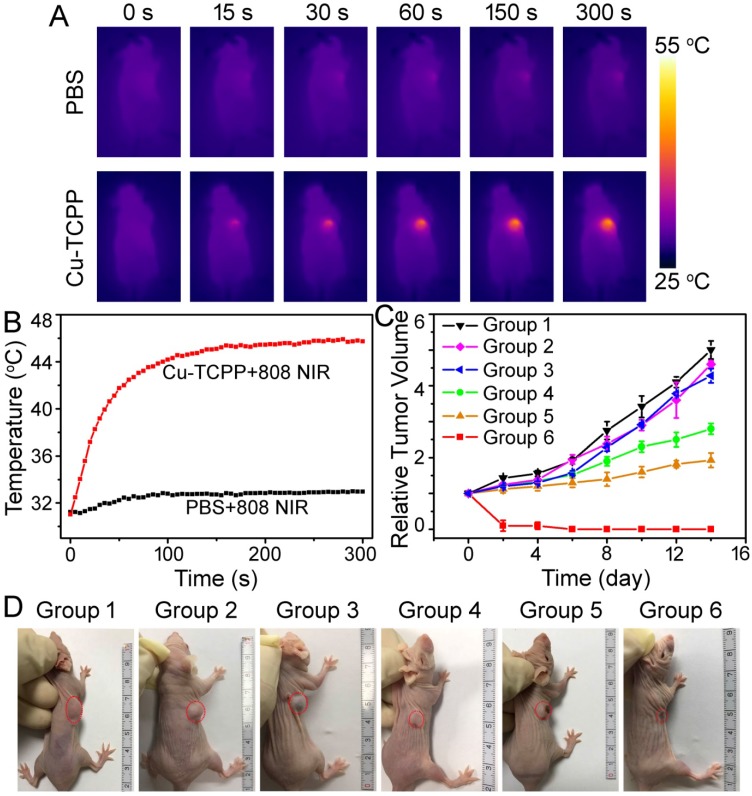
Figure 6.
(A) Infrared thermal imaging of tumor-bearing mice after the intratumoral injection of PBS or nanosheets and exposure to 808 nm laser irradiation at a power density of 1.0 W cm-2. (B) Temperature change curves of tumors in mice from (A) as a function of irradiation time. (C) Growth curves of tumors in mice from different treatment groups. Tumor volumes were normalized to their initial sizes. Error bars represent the standard deviations of 5 mice per group. (D) Representative photos of mice in different groups on day 14 after different treatments. The position of tumors is marked by the red dotted circles. Group 1: PBS; Group 2: Cu-TCPP; Group 3: PBS + PTT + PDT; Group 4: Cu-TCPP + PDT; Group 5: Cu-TCPP + PTT; Group 6: Cu-TCPP + PTT + PDT.

