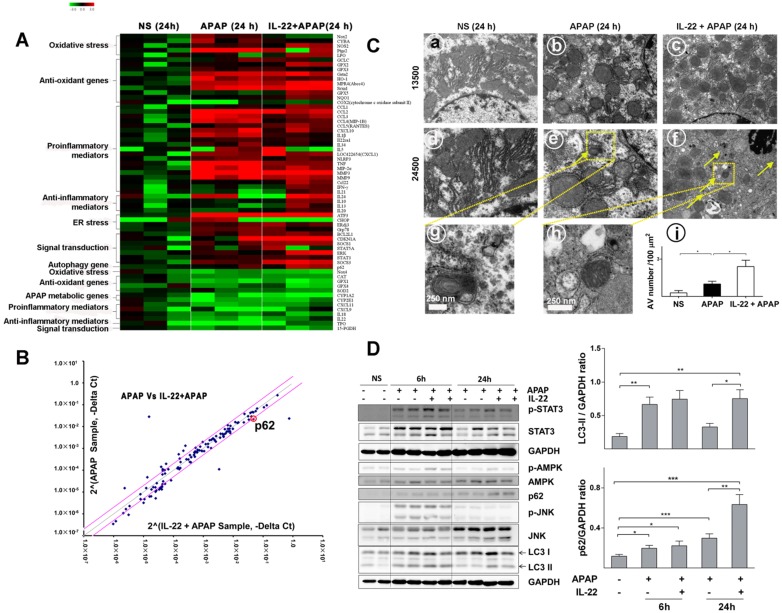
Figure 3.
Divergent transcriptome expression patterns of hepatic oxidative stress, inflammation and autophagy genes in vehicle-, APAP- or IL-22 plus APAP-treated mice. (A) Heatmap displaying the relative expression of oxidative stress-, inflammation- and autophagy-related genes in normal control, APAP-treated and IL-22 plus APAP-treated groups (n = 3 per group) at 24 h. (B) Relative gene expression profiles between APAP-treated vs. IL-22 plus APAP-treated mice (n = 3). The red lines indicate positive or negative fold changes (upregulated 2-fold or down-regulated 0.5-fold) for selected genes in APAP- vs. IL-22 plus APAP-treated mice. (C) Mice liver samples were analyzed by TEM. (a, d) Mice treated with normal saline (NS); (b, e, g) mice treated with APAP; (c, f, h) mice treated with IL-22 plus APAP; (i) the number of autophagosomes in hepatocytes per 100 μm2 were compared among three groups. Yellow arrows indicate autophagosomes. (D) The protein expressions of p-STAT3, STAT3, p-AMPK, AMPK, p62, p-JNK, JNK and LC3-I/II in livers from normal control (NS), APAP (400 mg/kg)-treated, and IL-22 plus APAP-treated mice were detected at 6 and 24 h post-APAP by western blot. GAPDH served as a loading control. Quantification of the LC3-II and p62 to GAPDH expression ratios. Data are presented as means ± SEM; p value was calculated by Kruskal-Wallis test (C-D), *p < 0.05, **p < 0.01 and ***p < 0.001.

