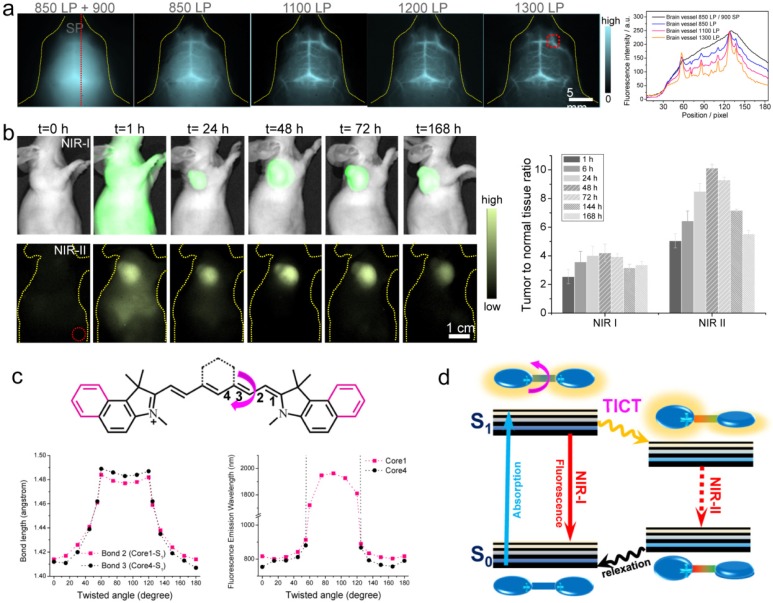
Figure 6.
NIR-II imaging with tail emission of IR-12N3. a) Brain vessel imaging with IR-12N3 at different NIR-I and NIR-II sub-windows. Right figure shows fluorescent cross-sectional intensity profile of brain vessel in both NIR-I and NIR-II windows. b) Targeting tumor imaging under NIR-I/II windows and corresponding tumor-to-normal tissue ratios of IR-12N3@Erbitux treated SCC tumor bearing mice. c) Core structures of ICG (core 1) and IRDye800/IR-12N3 (core 4); Below profiles show the calculated bond lengths of bond 2 of core 1 and bond 3 of core 4 as a function of twisted angles (left) as well as simulated fluorescence emission wavelength of core 1 and core 4 as a function of twisted angles (right). d) Schematic illustration of the origin of emission tail and TICT proposed in NIR-I dyes. Reprinted with permission from Ref. 40.

