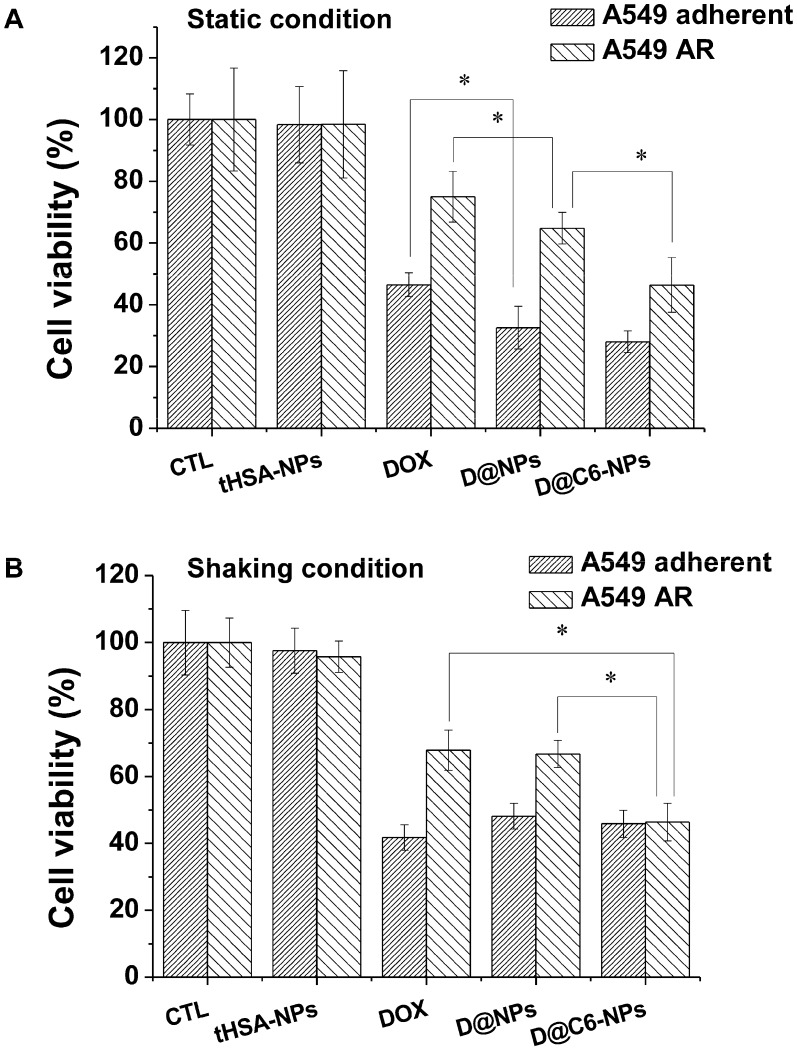
Figure 6.
Cell viability assay with parental A549 adherent and A549 AR cells. Cells were treated at a concentration corresponding to 100 nM DOX for 6 h under (A) static and (B) shaking condition, and further cultured up to 72 h in fresh medium. Bar with dense line and sparse line represent A549 adherent and A549 AR cells, respectively. Asterisk (*) denotes p<0.05 between two groups.

